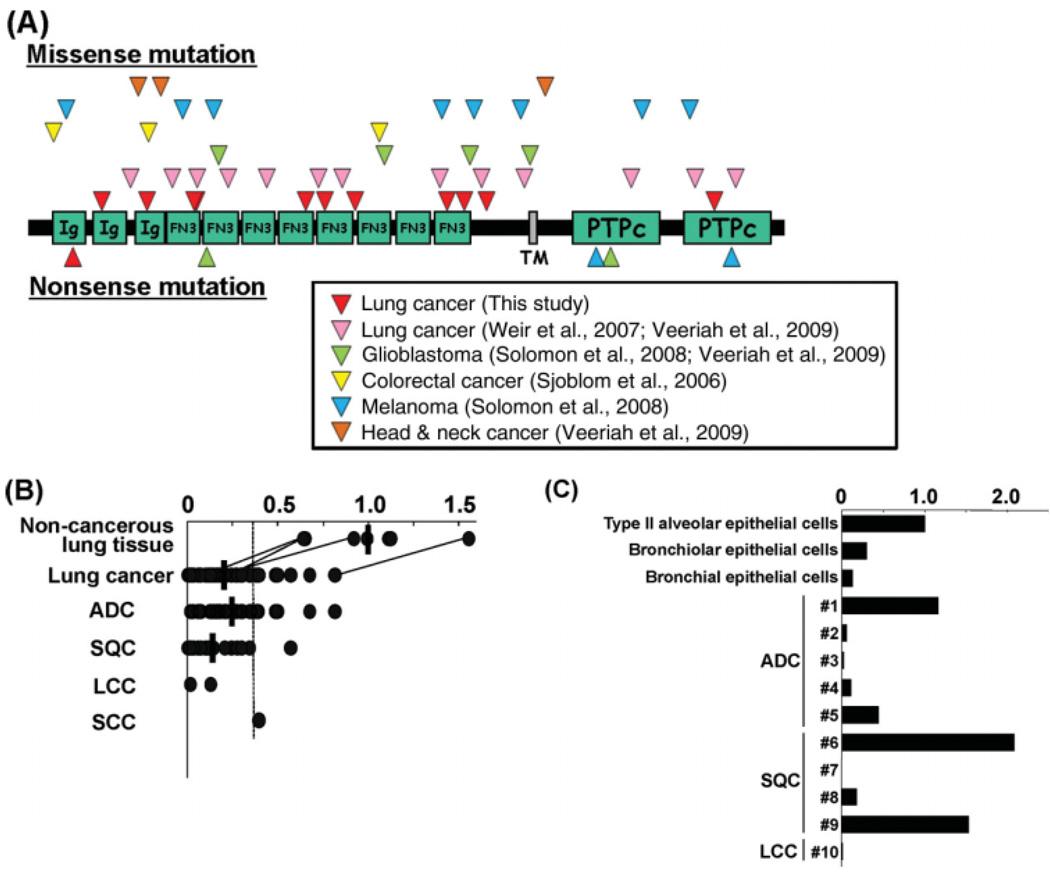
Figure 2.
PTPRD mutation and expression in lung cancer. (A) Location of missense and nonsense mutations detected in the present and previous studies. Ig, immunoglobulin-like C2-type domain; FN3, fibronectin type III domain; TM, transmembrane domain; PTPc, protein tyrosine phosphatase catalytic domain. (B) Expression in macro-dissected cancerous and noncancerous lung cells. Values for four paired noncancerous and cancerous lung tissues are connected. Expression levels are indicated after adjusting the mean for the levels of expression in seven cases of noncancerous lung tissues to 1. Mean values are indicated by horizontal bars if the group has three or more samples. The threshold level to judge as reduced expression is indicated by a dashed line. (C) Expression in micro-dissected cancerous and noncancerous lung cells. The levels of PTPRD expression relative to those of GAPDH expression are shown after adjusting the level of PTPRD expression in type II alveolar epithelial cells to 1.

