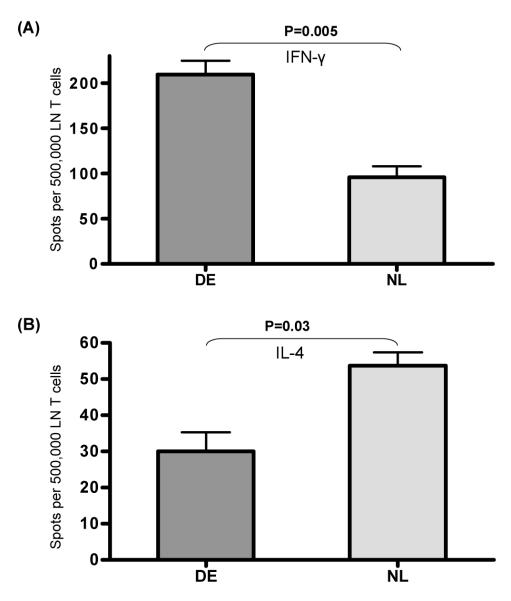
Figure 2. Analysis of T cell cytokine secretion.
The frequencies of reactive T cells upon CD3 stimulation from draining LN of DE vs. NL mice were evaluated using the ELISPOT assay for(A) IFN-γ and (B) IL-4. The results are depicted as the mean number of spots per 0.5 million responder T cells loaded ± SEM. Data shown are representative of three independent experiments.

