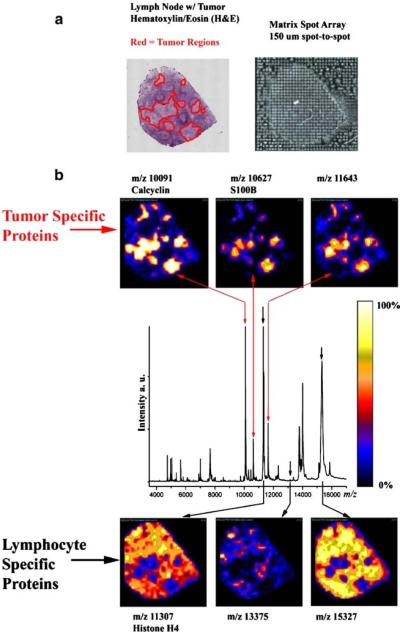
Fig. 1.
MALDI IMS applied to a stage III metastatic melanoma invading the lymph node. a Optical hemotoxylin/eosin stain is shown with the tumor regions outlined in red. Matrix was robotically deposited at 150-μm spacing. b Ion density images of proteins with higher observed intensities in the tumor and normal lymphocyte regions are shown. See text for protein identification workflow

