
FIG. 1.
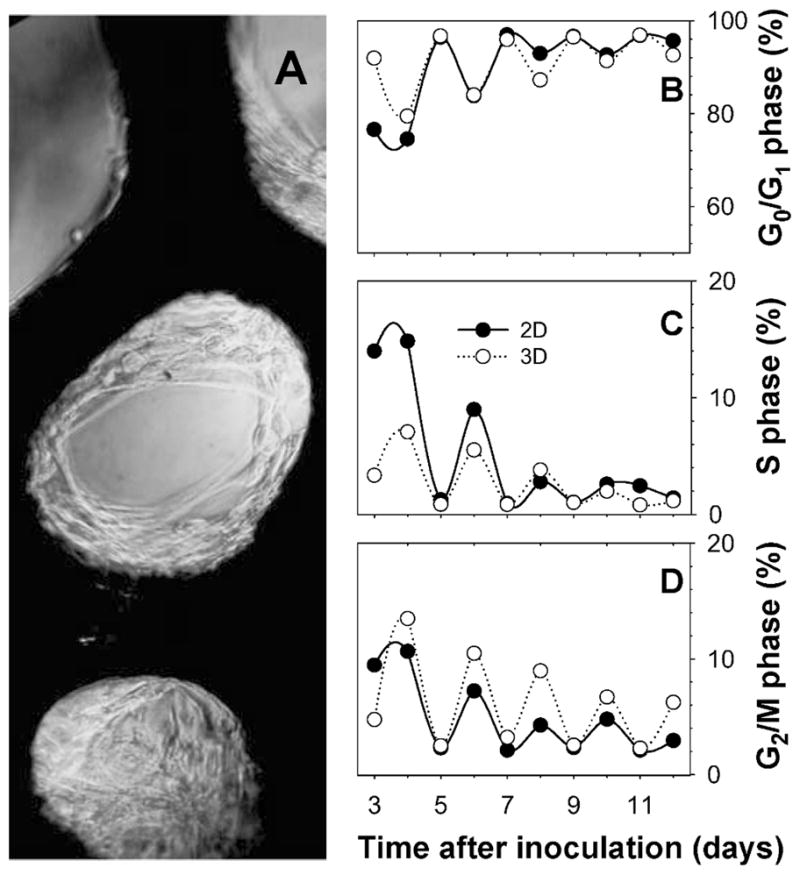
Characterization of the Cytomatrix™ 3D culture model. Panel A: AG1522 fibroblasts adapted to grow in 3D on Cytomatrix™ units, which appear dark in bright-field microscopy. Panels B, C and D: cMEM feeding regimen determines the cell cycle distribution and therefore the fraction of cells that may be targeted via pulse labeling with 3HdC. G0/G1- (panel B), S- (panel C), and G2/M-phase fractions (panel D) were measured as function of time after inoculation with cells in 2D (●) or 3D Cytomatrix™ (○) cultures. Cultures were fed with cMEM on odd-numbered days after inoculation.