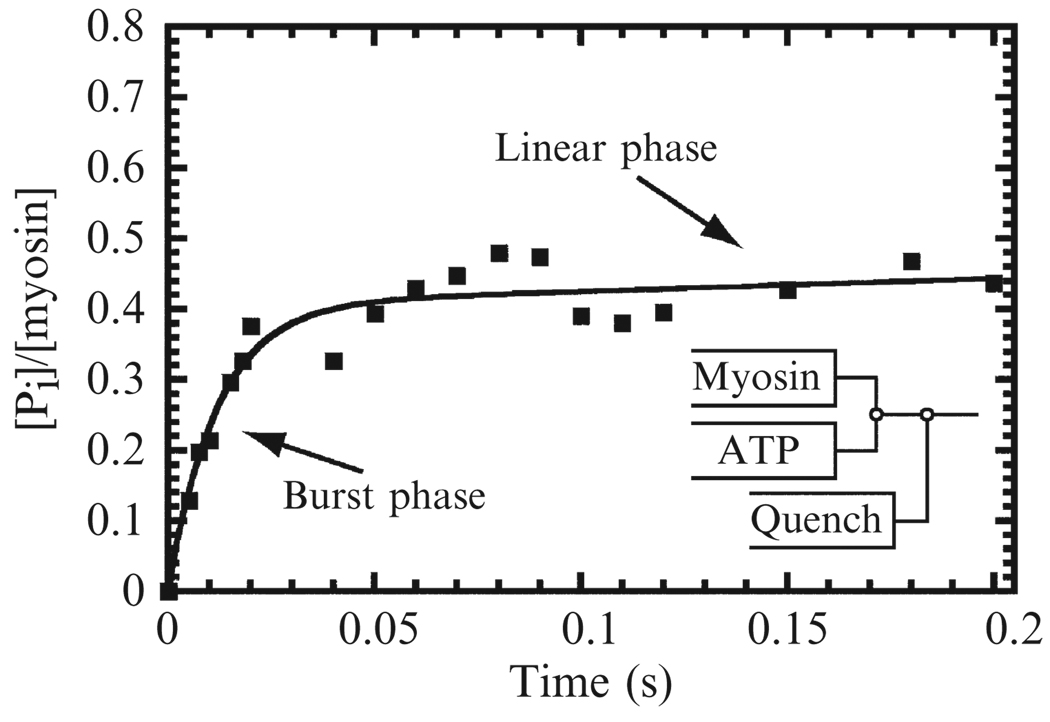
Figure 6.4. Time course of ATP hydrolysis and ADP-Pi burst of myosin V.
Time course of ADP-Pi formation by a single-headed myosin V construct after mixing with 100 µM ATP. The solid line is the best fit of the data to Eq. (6.9) with an observed rate constant of 84 ± 13 s−1 and burst amplitude of 0.43 ± 0.03 Pi/myosin. Data are from (De La Cruz et al., 2000b).

