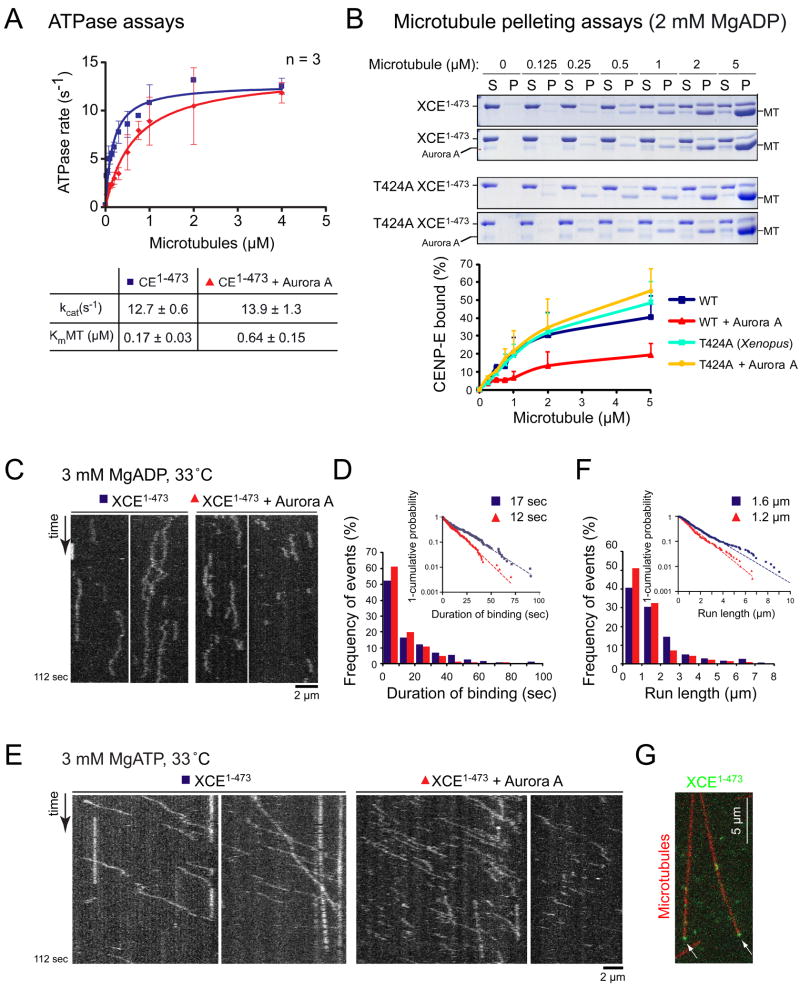
Figure 2.
Phosphorylation of T424 (Xenopus) by Aurora kinase reduces CENP-E’s affinity for microtubule and reduces its run length in vitro. (A) ATPase rates of Xenopus CENP-E1-473 and phosphorylated CENP-E1-473 measured with increasing concentrations of microtubules. Plots show the mean of three independent experiments and error bars represent SEM. kcat and KmMT values are represented ± SEM. (B) Equilibrium binding of WT or T424A CENP-E1-473 (incubated with or without Aurora A) to microtubules in the ADP state. S, supernatant; P, pellet. Percent of CENP-E1-473 bound is shown below (n=3; Error bars represent SEM). (C) Kymographs showing diffusive motion of CENP-E1-473-RFP pre-incubated with or without Aurora A in 3 mM MgADP at 33 °C. (D) Duration of binding (t) was distributed exponentially, and the mean binding time (tmean) was determined by fitting the data into a cumulative distribution function (exp [-t/tmean]). Inset shows 1-cumulative probability of CENP-E1-473-RFP binding time plotted on a log scale. The tmean is 17 ± 0.13 sec for CENP-E1-473-RFP, n = 231 and 12 ± 0.07 sec for CENP-E1-473-RFP plus Aurora A, n = 240. Values represented ± SE of the curve fit. Probability < 0.0001 that the duration of binding for CENP-E1-473-RFP plus Aurora A was distributed the same as the duration of binding for CENP-E1-473-RFP (by Kolmogorov-Smirnov Test). (E) Kymographs showing processive motion of CENP-E1-473-RFP in the presence of 3 mM MgATP at 33 °C. See Movie S1. (F) Run length of CENP-E1-473-RFP was determined by fitting the data into a cumulative distribution function. Inset shows 1-cumulative probability of CENP-E1-473-RFP run length plotted on a log scale. Mean run length is 1.6 ± 0.02 μm for CENP-E1-473-RFP, n=337 and 1.2 ± 0.02 μm for CENP-E1-473-RFP plus Aurora A, n=294. See Movie S1. Probability < 0.05 that the run lengths for CENP-E1-473-RFP plus Aurora A were distributed the same as the CENP-E1-473-RFP run lengths (by Kolmogorov-Smirnov Test). Values represent ± SE of the curve fit. (G) Accumulated CENP-E (green) at the end of the microtubules (red). See also Figure S3.

