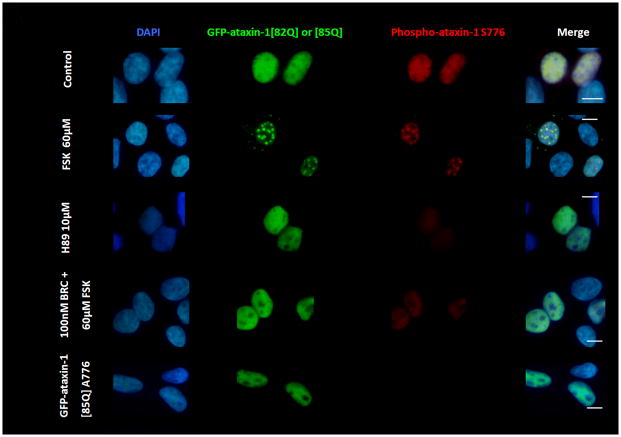
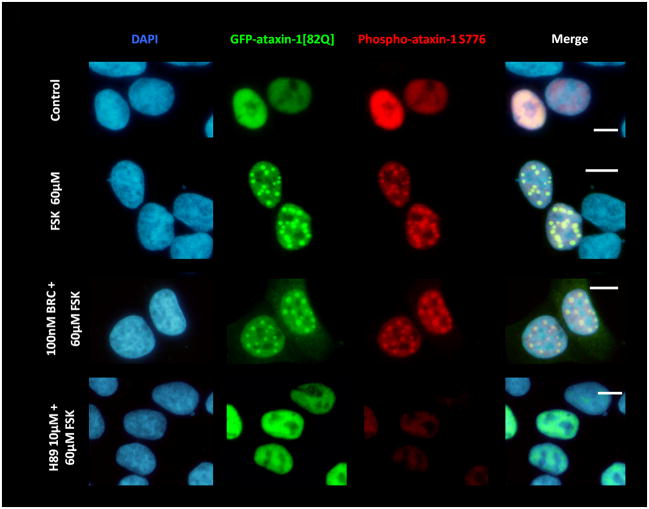
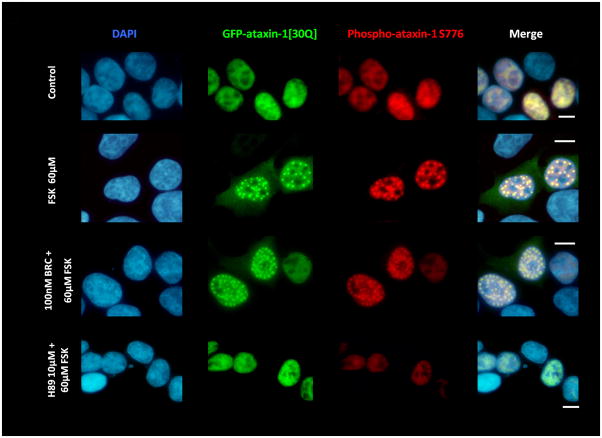
Figure 2.
(A) D2R/S100B HEK cells were transfected with GFP-ataxin-1[82Q] S776 or GFP-ataxin-1[85Q] A776. Cells expressing GFP-ataxin-1[82Q] S776 were serum starved overnight in 2% FBS, then pretreated for 2hrs with 2% FBS as the control, BRC, or H89, then treated for additional 2hrs with FSK, BRC+FSK, BRC, or control in 2% FBS. Cells expressing GFP-ataxin-1 [85Q] A776 were treated for 4hr with 2% FBS. Cells show DAPI staining in blue, GFP in green and phospho-ataxin-1 S776 in red. H89 treated cells showed less phospho-ataxin-1 S776 fluorescence. GFP-ataxin-1[85Q] A776 showed no phospho-ataxin-1 S776 fluorescence and failed to from inclusions. WT HEK cells were transfected with GFP-ataxin-1[82Q] S776 (B) and GFP-ataxin-1[30Q] S776 (C) and treated under the former conditions. BRC treatment had no impact on FSK induced inclusion formation in both GFP-ataxin-1[82Q] and [30Q] expressing cells. Scale bars: 10μm.


