Figure 4.


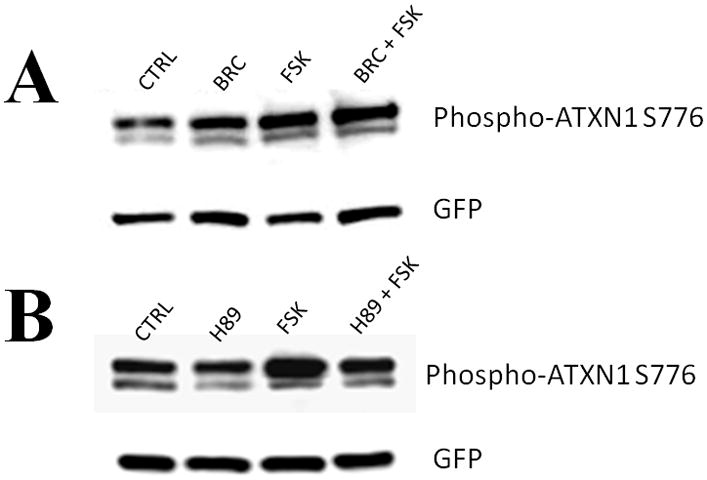
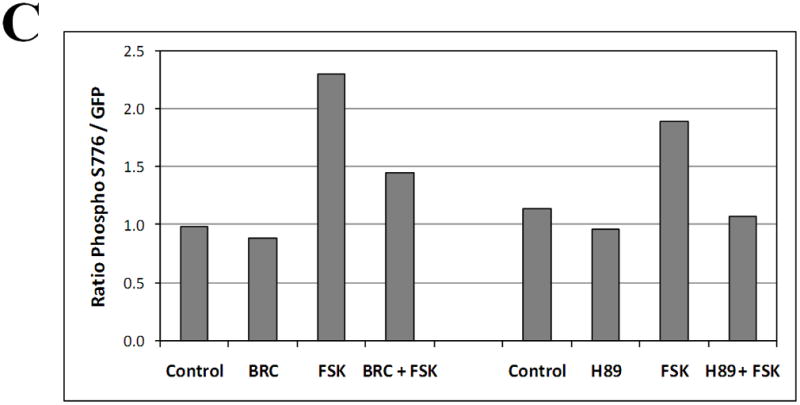
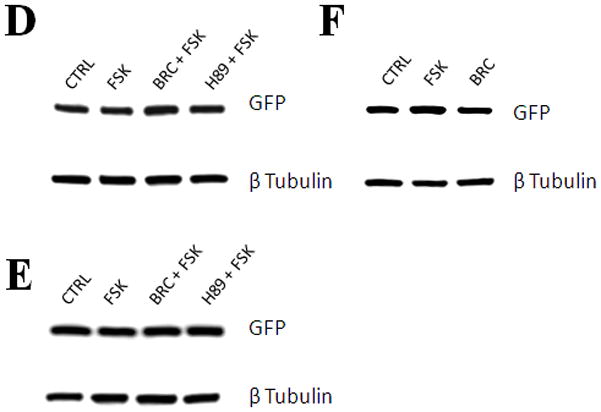
Western blot of lysates from D2/S100B HEK cells expressing GFP-ataxin-1[82Q] treated as previously described (Fig. 3B) and detected with GFP and phospho-ataxin-1 S776 antibodies. (A) Lanes: Control, 100nM BRC, 60μM FSK, BRC + FSK. (B) Lanes: Control, 10μM H89, 60μM FSK, H89 + FSK. (C) Optical densities of the protein bands were taken using Image J software. FSK increased ataxin-1 S776 phosphorylation compared to control, while BRC and H89 impeded FSK stimulated S776 phosphorylation of ataxin-1. Western blots from the lysates of WT HEK cells expressing GFP-ataxin-1[30Q] (D), [82Q] (E) and GFP alone (F) were used to monitor the effect of drug treatments on the CMV promoter activity. Blots were probed with GFP and β Tubulin antibodies.
