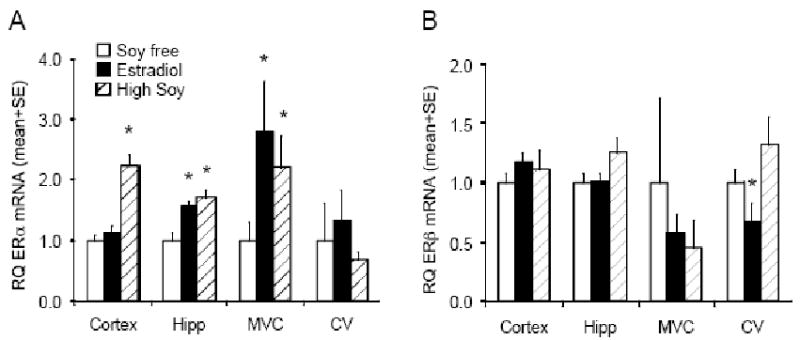
Figure 4.

Expression of ER mRNA and protein in brain and cerebral vessels. Relative ERα (A) and ERβ (B) mRNA levels in cerebral cortex (Cortex), hippocampus (Hipp), brain microvascular cells (MVC), and large cerebral vessels (CV) in soy free control (SF, open bars), estrogen treated (E2, filled bars), and soy fed (HS, hatched bars). Values represent relative mRNA quantity (RQ) corrected for GAPDH and normalized to the soy free control (mean ± SE; n=6). * indicates significant difference from soy free control, P<0.05.
