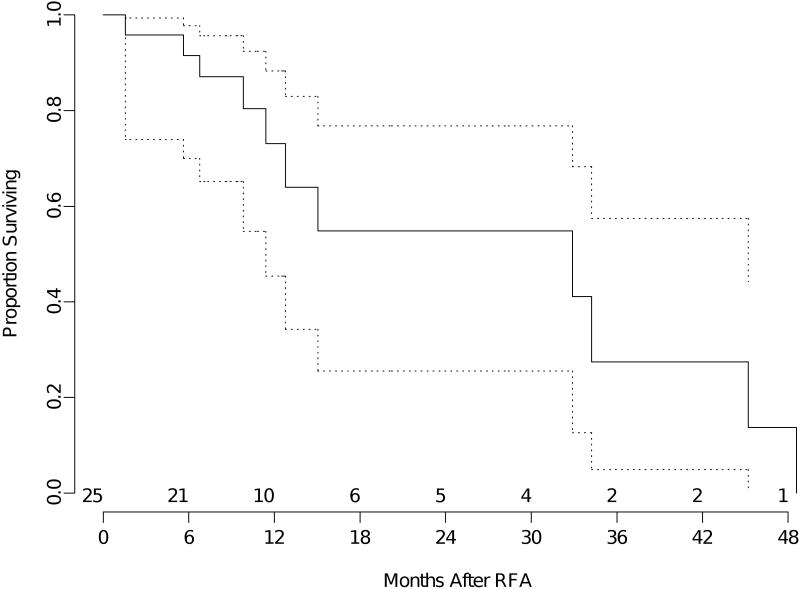
Figure 2.
Kaplan-Meier analysis of overall survival of patients with recurrent lung cancer. The time shown is in x axis is in months from RFA. The dotted lines are 95% confidence bands for the probability of overall survival. The number of patients at risk at the start of each 6 month interval is included above the x axis.

