Figure 3.

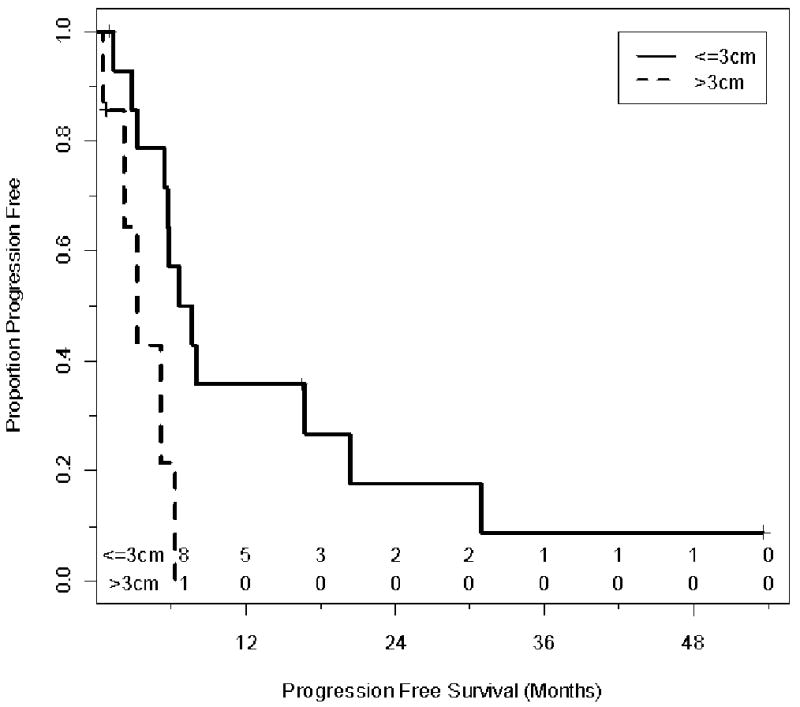
Kaplan-Meier Plot illustrating the progression free survival stratified by size. The time shown is in x axis is in months from RFA (Log Rank=0.01). The number of patients at risk is shown above the X-axis.

Kaplan-Meier Plot illustrating the progression free survival stratified by size. The time shown is in x axis is in months from RFA (Log Rank=0.01). The number of patients at risk is shown above the X-axis.