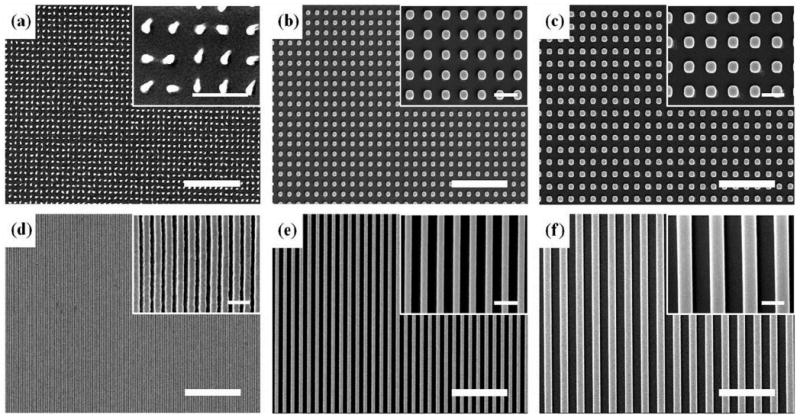
Figure 2.

Planar SEM images of the fabricated nanopatterns by UV-assisted CFL. Scale bars represent 5 μm and 1 μm in the panel and inset images, respectively. (a) 150-nm diameter and 500-nm pitch dots. (b) 400-nm diameter and 800-nm pitch dots. (c) 600-nm diameter and 1200-nm pitch dots. (d) 150-nm width and 200-nm pitch lines. (e) 400-nm width and 800-nm pitch lines. (f) 600-nm width and 1200-nm pitch lines.
