
Figure 3.
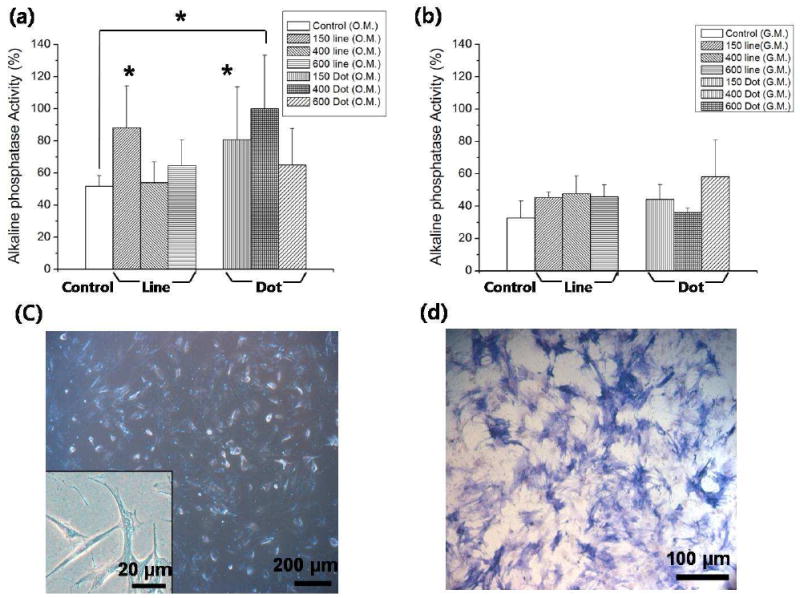
ALP expression level of the hMSCs plated at 3000 cells/cm2, cultured for 8 days in (a) OM and (b) GM. The data were normalized with respect to the highest level of ALP activity for 400-nm dot pattern both in OM and GM. As shown, the ALP activity was increased for the patterned substrates both in OM and GM compared to the control group. Especially, the hMSCs cultured on 150-nm line, 150-nm dot, and 400-nm dot patterns in OM showed significantly high ALP activity level (p < 0.01). *: p < 0.01. (c) Bright-field images of hMSCs cultured on 400-nm dot pattern in OM, plated at 3000 cells/cm2, cultured for 8 days. Bar = 200 μm. Inset shows a magnified image of osteogenic hMSCs exhibiting a spindle shape. Bar = 20 μm. (d) Fluorescent image of hMSCs cultured on 400-nm dot pattern in OM stained for ALP (osteogenic marker). Bar = 100 μm.