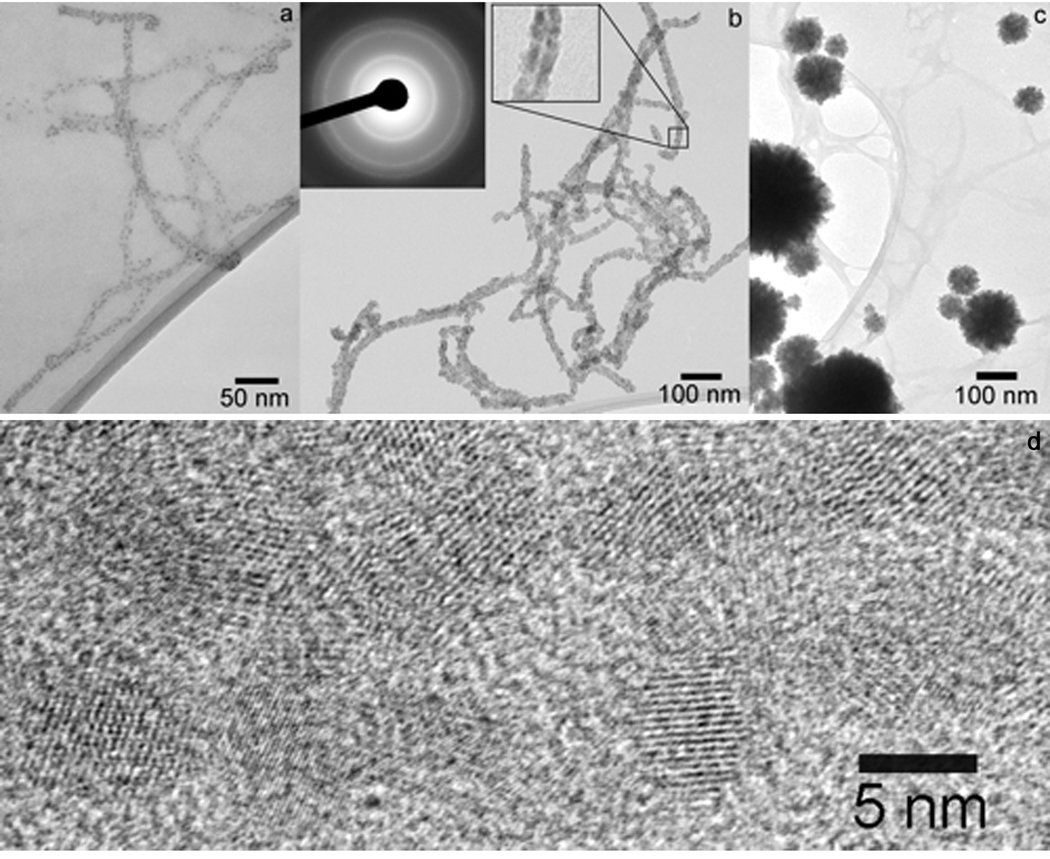
Figure 5.
Bright field TEM micrographs of CdS mineralized suspensions of PA fibers at various Cd2+:PA molar ratio. (a) Cd2+:PA = 2.4:1; (b) Cd2+:PA = 24:1. Left inset shows an electron diffraction pattern corresponding to the CdS zinc blende structure. Right inset shows an enlargement of a portion of an encapsulated fiber highlighting the strip of lower electron density through the middle corresponding to the hydrophobic core. (c) Cd2+:PA = 240:1. (d) High-resolution TEM micrograph showing the lattice structure of CdS nanocrystals grown on a PA fiber. Fiber axis is parallel to the long axis of the micrograph55.

