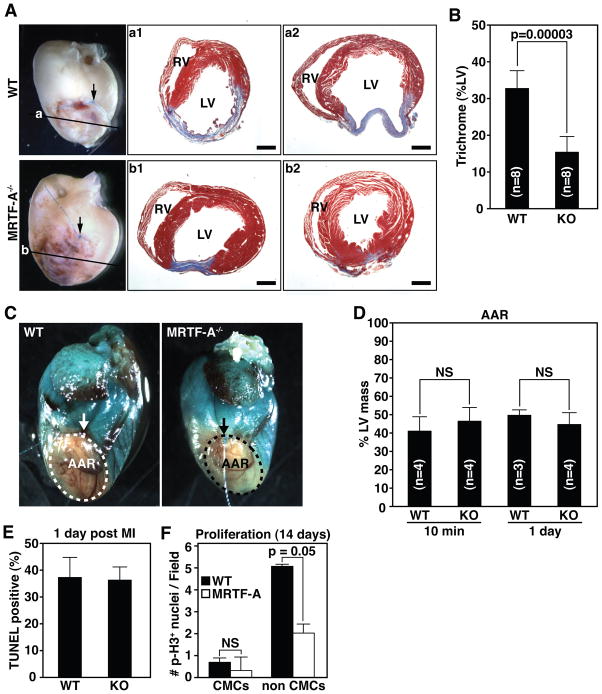
Figure 1. MRTF-A deletion results in reduced scar formation following MI.
(A) Whole-mount images of representative hearts 14 days post-MI and Masson’s trichrome staining of sections from two representative hearts. Arrow denotes point of ligature and plane of section is illustrated by horizontal line. Masson’s trichrome staining illustrates reduced and more compact region of scarring in the infarct zone (compare a1 and a2 to b1 and b2) RV, right ventricle; LV, left ventricle. Scale bar = 1 mm.
(B) Quantification of infarct size presented as the percent LV area positively stained with Masson’s trichrome. n=8 WT and 8 KO animals.
(C) Area at risk (AAR) determined by perfusion with methylene blue. AAR is devoid of staining. Arrow denotes point of ligature on the LAD.
(D) Quantification of AAR presented as percent of LV mass that is not stained 10 minutes and 1-day post-MI. n=4 WT and 4 MRTF-A−/− animals at 10 min and 3 WT and 3 MRTF-A−/− animals 1-day post-MI.
(E) Quantification of TUNEL positive cells 1 day post-MI was performed on at least 4 independent fields within the infarct zone of each heart and averaged from 2 WT and 3 MRTF-A−/− animals. Data is represented as percentage of Dapi stained nuclei positive for TUNEL.
(F) Quantification of phospho-histone H3 postive cells 14 days post-MI was performed on at least 7 independent fields in the BZ from each heart and averaged from 3 WT and 4 MRTF-A−/− animals. Error bars indicate the SEM.

