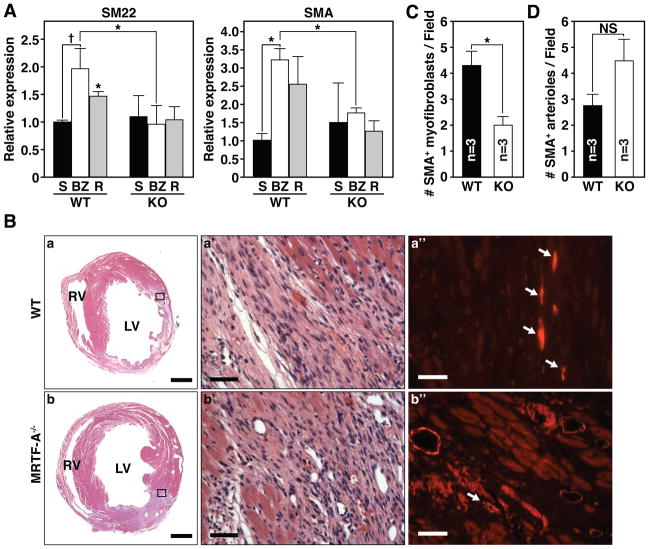
Figure 3. MRTF-A deletion results in altered smooth muscle gene expression 14 days post-MI.
(A) Real time PCR reveals a significant reduction of SM22 and SMA induction in both the BZ and remote region of MRTF-A−/− hearts (* denotes p-value < 0.01, and † denotes p-value < 0.05). n=4 WT and 4 MRTF-A−/− hearts per infarct group and 2 shams.
(B) Histological sections of hearts from WT and MRTF-A−/− mice, 14 days post-MI are shown. H&E stained (a, b) sections of representative hearts adjacent to those used for immunohistochemistry illustrate ischemic damage and highlight the BZ of the infarct. (a’ and b’) Magnification of region that is boxed in a and b. (a” and b”) SMA immunostaining corresponding to the boxed region of representative WT and MRTF-A−/− infarcted hearts. Arrows mark SMA-positive spindle-shaped myofibroblasts. Scale bar for a, b = 1mm. Scale bar for a’, a” and b’, b” = 40 μm.
(C) Number of SMA-positive myofibroblasts per field of view.
(D) Number of SMA positive arterioles in the BZ per field of view. n=3 WT and 3 MRTF-A−/− hearts. Error bars represent the SEM. Quantification was performed at 40x magnification on at least 3 fields of view within the BZ of each heart and averaged from 3 WT and 3 MRTF-A−/− hearts (* denotes p-value < 0.05). Error bars represent the SEM.

