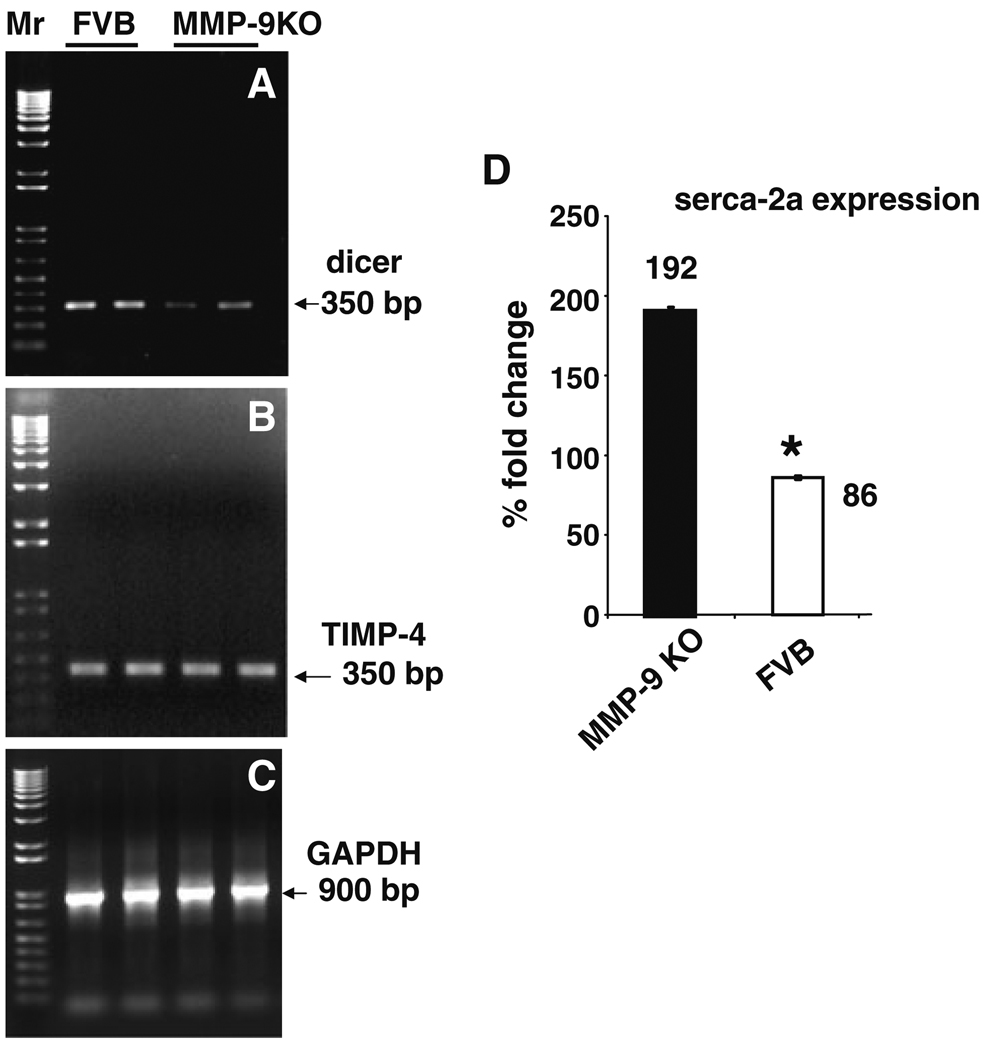
Fig. 7.
Semi-quantitative RT-PCR analysis of dicer, TIMP-4, and serca-2a. The mRNA from FVB and MMP-9KO cardiomyocytes was isolated and amplified for dicer (a) and TIMP-4 (b) regions. GAPDH (c) was used as loading control. d The bar graph represents real-time PCR amplification of serca-2a in FVB and MMP-9KO cardiomyocytes. GAPDH was used as endogenous control. Each bar represents average ± SD from 5 to 7sets of myocytes preparation. * P < 0.05 compared with FVB myocytes

