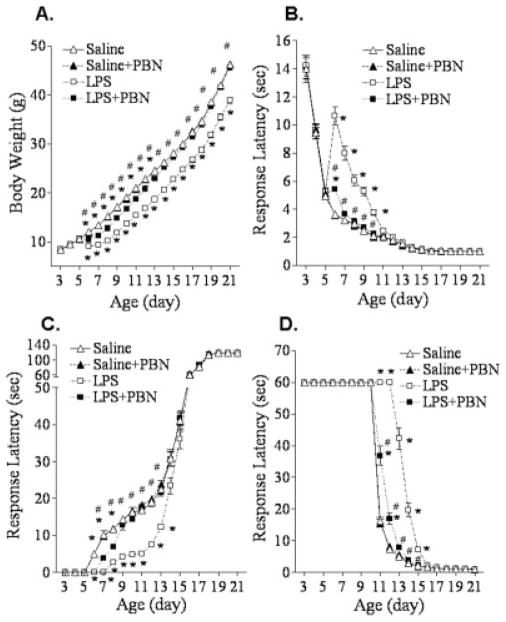
Fig. 1.
PBN attenuated LPS-induced body weight loss (A), elongation of mean latency times in righting reflex (B), reduction of mean latency times in the wire hanging maneuver (C), and deficits in cliff avoidance (D) in the rat. Results are expressed as the mean ± SEM of 12 animals in each group. ★P < 0.05 represents a significant difference for the LPS group or LPS + PBN group compared with the saline group. #P < 0.05 represents a significant difference for the LPS + PBN group compared with the LPS group. (A) Markers of ★ below curves are for the LPS group compared with the saline group and markers of ★ and # above curves are for the LPS + PBN group compared with the saline group and LPS group, respectively.

