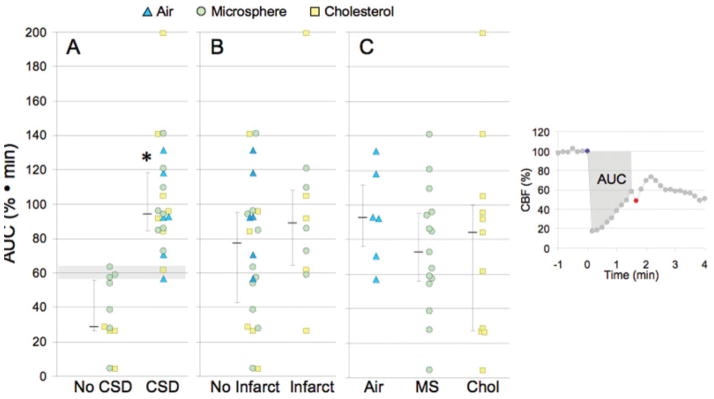
FIGURE 3.
Ischemic burden and its relationship to cortical spreading depression (CSD) and infarct occurrence. Ischemic burden (area under the curve [AUC]) was calculated by measuring the area under the cerebral blood flow (CBF) curve between the injection of microemboli (blue circle) and the onset of CSD (red circle), as shown in the inset on the right. (A) The occurrence of CSD was associated with significantly higher AUC values than experiments without CSD; 60% · min (horizontal shaded area) was the AUC threshold for evoking CSD. (B) AUC values did not differ significantly between the animals with or without infarcts, regardless of the embolic particle. (C) The AUC values did not differ between the 3 types of microemboli. Individual data points as well as median (25–75% range) are given for each group. *p < 0.01 vs no CSD; Mann-Whitney rank sum test. MS = microsphere; Chol = = cholesteol.

