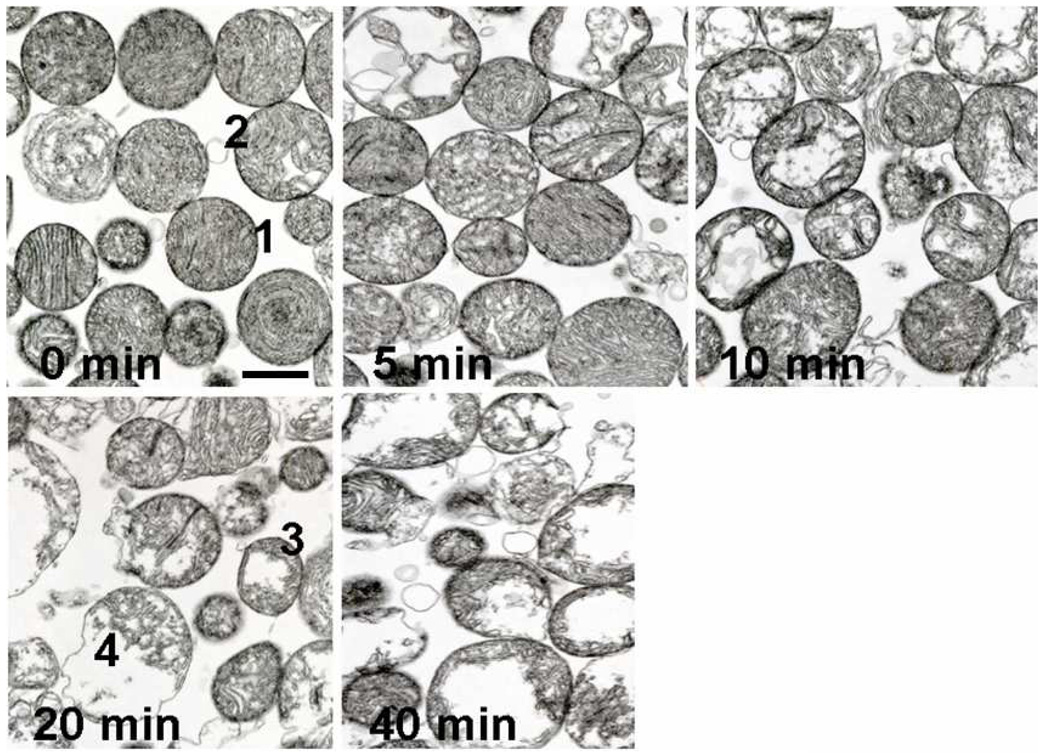
Figure 2.
Time course of mitochondrial structural changes observed by transmission electron microscopy. Isolated rat cardiac mitochondria, pretreated with Pc 4, and continuously illuminated for various times (minutes) were then prepared for electron microscopy. Control Pc 4 treated mitochondria (0). Structural changes were quantified by subdividing mitochondria into four classes with increasing disruption; typical members of each quartile are numbered 1–4 in the 0 and 20 min micrographs.

