Figure 3.

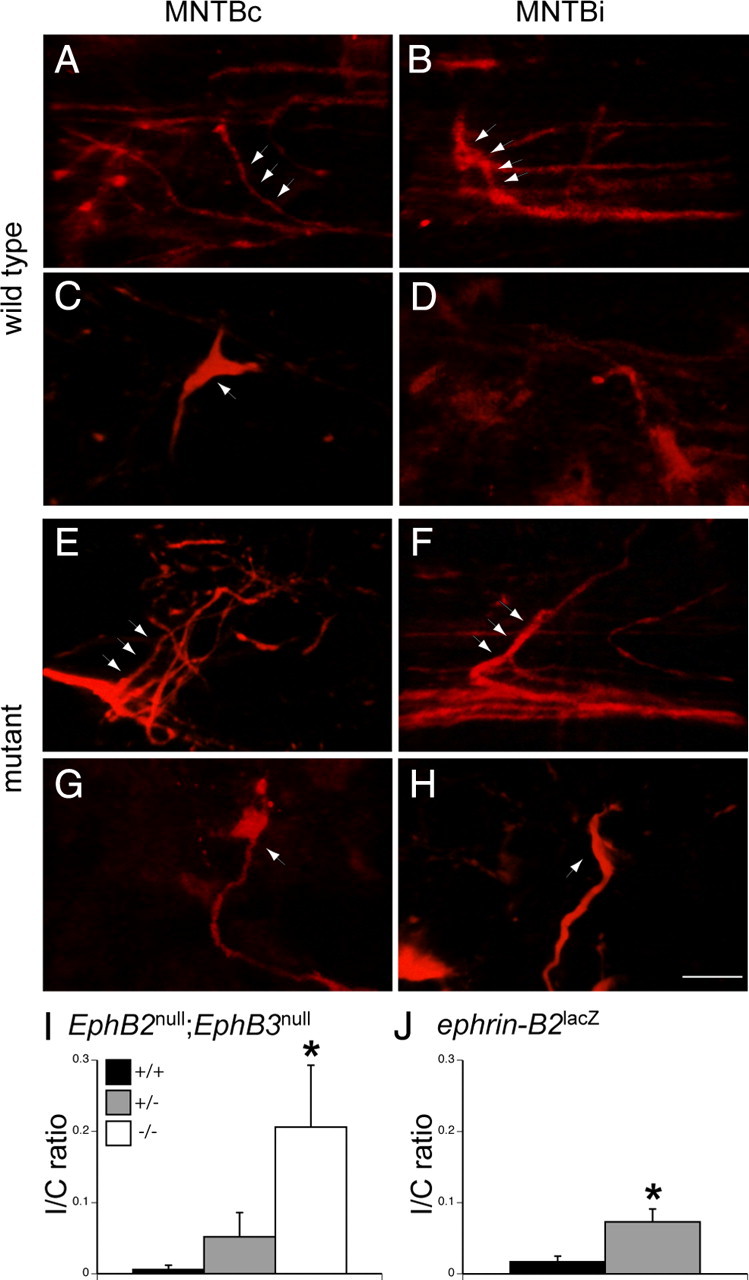
Aberrant projections develop at the same time as normal projections. These images were obtained from P3 and P4 EphB2 wild-type and EphB2 null mice. Both mice have a null mutation in EphB3 that does not affect the VCN–MNTBc projection. In the wild type: A, RDA labeling in a P3 wild-type mouse reveals small axon branches emerging from the ventral acoustic stria in MNTBc. B, Similarly, small branches are seen in MNTBi. In A and B, arrows indicate labeled axon branches. C, RDA labeling in a wild-type mouse at P4 reveals an immature calyceal termination (arrow) in MNTBc. D, Branches in MNTBi do not have calyceal terminations. In the mutant: E, RDA labeling in a P3 EphB2 null mutant reveals small branches emerging from the ventral acoustic stria in MNTBc. F, Similarly, branches are seen in MNTBi. G, RDA labeling of a P4 EphB2 null mutants reveals an immature calyceal termination in MNTBc. H, In these mutants, abnormal projections with immature calyceal terminations are present in MNTBi. In G and H, arrows indicate rudimentary calyceal terminations. I, I/C ratios from the EphB2null;EphB3null mouse line indicate that, even at this young age (P4–P5), there are significantly more aberrant projections (*) from VCN to MNTBi in EphB2−/−;EphB3−/− than EphB2+/+;EphB3−/− or EphB2+/−;EphB3−/− mice. J, I/C ratios from the ephrin-B2lacZ mouse line indicate significantly more aberrant projections in ephrin-B2lacZ/+ than ephrin-B2+/+mice. *p < 0.05. Scale bar (in H): A–H, 10 μm.
