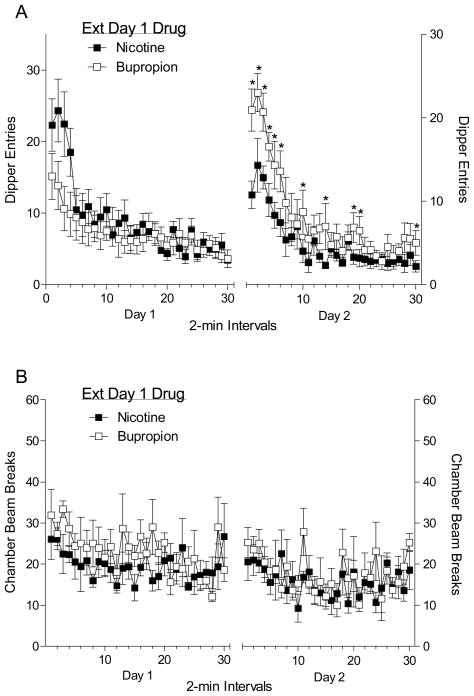
Figure 4.
The left graph of Panel A shows the mean (±1 SEM) dipper entries in 2-min intervals for the first 60-min session (n=8). The right graphs show the mean (±1 SEM) dipper entries for the second 60-min session when all rats received nicotine. Panel B shows the mean (±1 SEM) activity in 2-min bins for the first (left graph) and the second 60-min session (right graph). In all graphs the filled squares represent rats that received nicotine during the first 60-min session, and open squares represent rats that received bupropion during the first session. * denotes a significant difference (p<0.05) between the groups.

