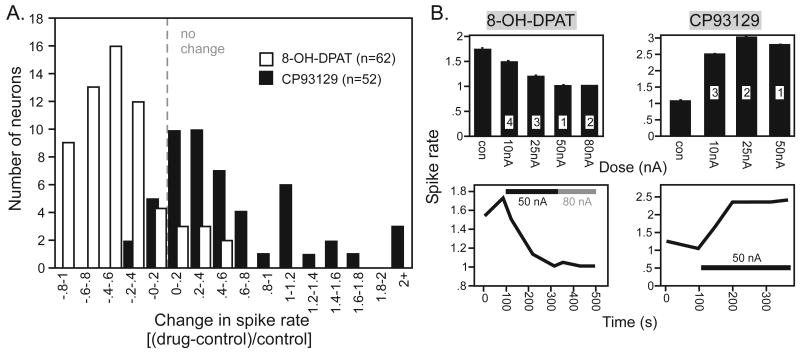
Figure 1.
Effects of two selective 5-HT1 agonists on evoked responses of IC neurons. A. Population histogram of proportional changes in spike rate [(drug-control)/control] at the characteristic frequency in response to application of the 5-HT1A agonist 8-OH-DPAT (n = 62) and the 5-HT1B agonist CP93129 (n = 52). B. Current-response plots (top) and timecourses (bottom) for each agonist. Numbers in the current-response plots refer to the order of application of different iontophoretic currents. Error bars represent the standard deviations of spike rates in different treatments. For a given agonist, current-response functions and timecourses were measured from the same neuron.

