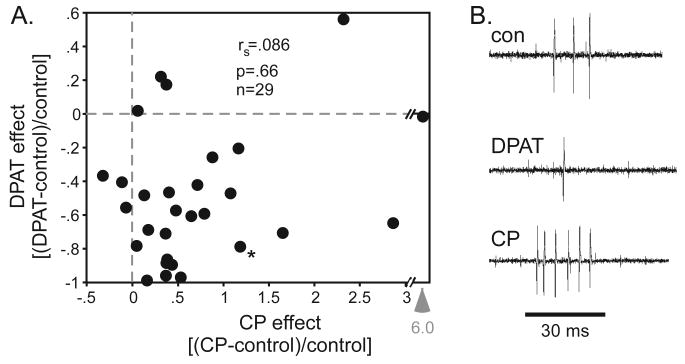
Figure 2.
Co-application of agonists. A. Proportional changes in spike rate for the application of 8-OH-DPAT versus CP93129 to the same neurons. Arrow indicates an outlying value for CP93129. B. Representative voltage traces of neuron marked with an asterisk in figure 2A. The stimulus is marked by the horizontal line and consisted of a tone at 19 kHz.

