
Figure 4.
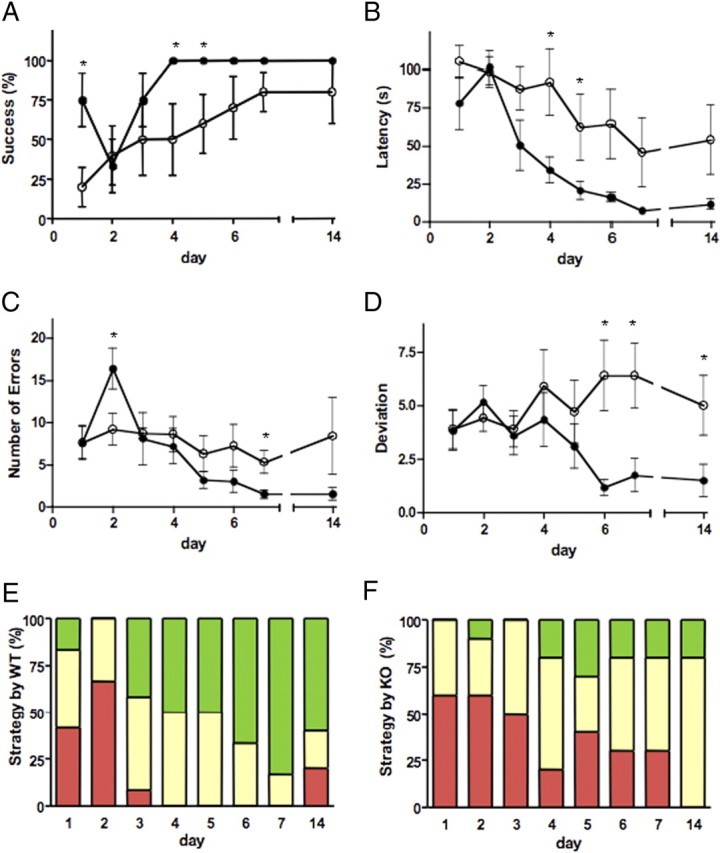
SIRT1-KO mice show spatial learning and memory impairment. A, Success of SIRT1-KO mice (n = 5; open circles) to find the escape box in the Barnes maze was lower than for WT mice (n = 6; *p < 0.001; filled circles). B, Latency to find the escape box significantly decreased in WT mice compared with SIRT1-KO (*p < 0.001). C, D, Number of total errors (C) and deviations from the first error (D) (*p < 0.001) were both higher in SIRT1-KO mice than WT mice. E, F, Search strategy of WT (E) and SIRT1-KO (F) mice (serial strategy, yellow; spatial strategy, green; random strategy, red). Data represent means ± SEM. Statistical significance values correspond to the differences between curves analyzed all over the acquisition phase. *p < 0.05, days with statistical significance.