
Fig. 5.
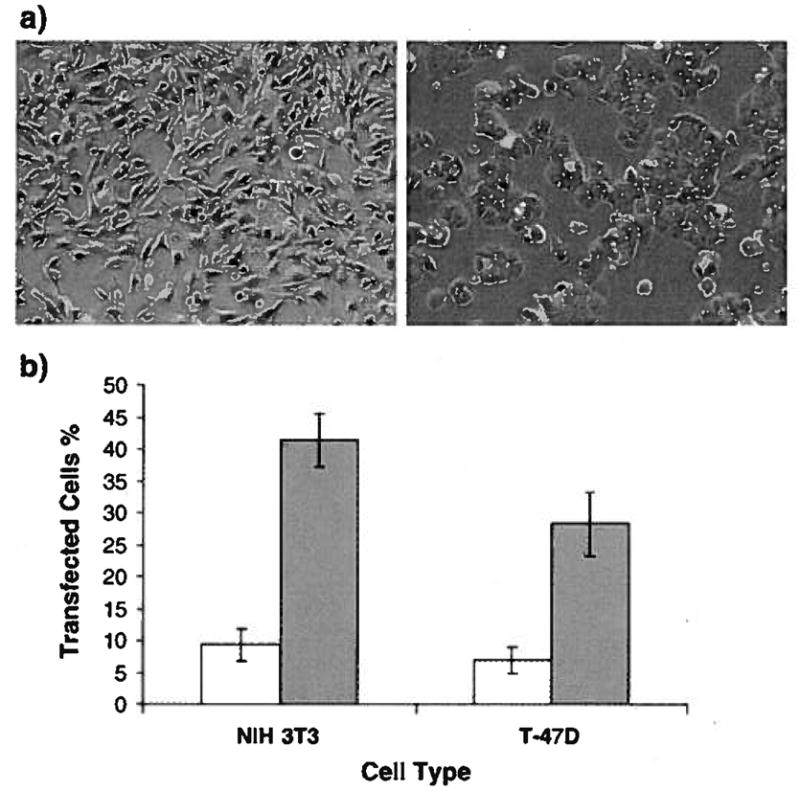
(a) Representative confocal images of NIH3T3 (left) and T47D (right) cells transfected with cKH-FGF2/pEGFP complexes. The green dots are the cells expressing green fluorescent protein (GFP). (b) Percentage of cells transfected with cKH-FGF2/pEGFP (closed bar) and dKH-FGF2/pEGFP (open bar). Cells were transfected with vectors in DMEM supplemented with serum. The percent transfected cells with cKH-FGF2 in NIH3T3 and T47D was 41 ±4 and 28±5, respectively (mean ± SD, n=9). The percentages of transfected cells with dKH-FGF2 in NIH3T3 andT47D were 9±3 and 7±2, respectively. (For interpretation of the references to color in this figure legend, the reader is referred to the web version of this article.)