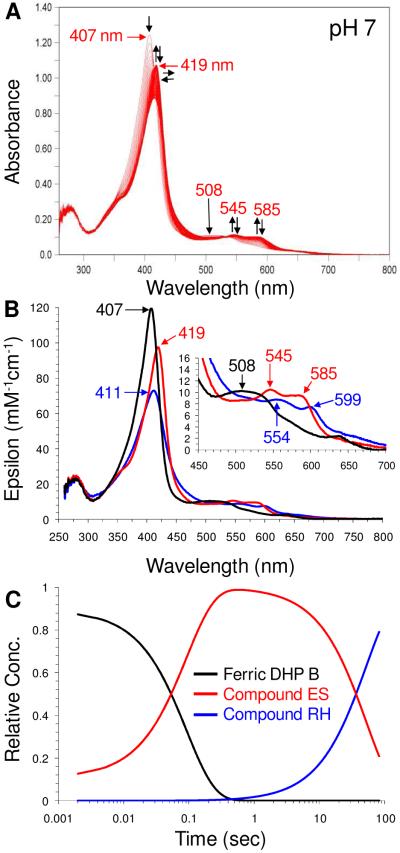
Figure 4.
(A) Stopped-flow UV-visible spectroscopic monitoring (900 scans, 85 sec) of the reaction between ferric DHP B (10 μM) and a 10-fold excess of H2O2 at pH 7. See Materials and Methods for details. (B) Calculated UV-visible spectra for ferric (black), Compound ES (red), and Compound RH (blue) DHP B are shown; the rapid-scanning data from panel A were compiled and fitted to a two-step, three species sequential irreversible model using the Specfit global analysis program. (C) Relative concentration profile determined from the three component fit used in panel B.

