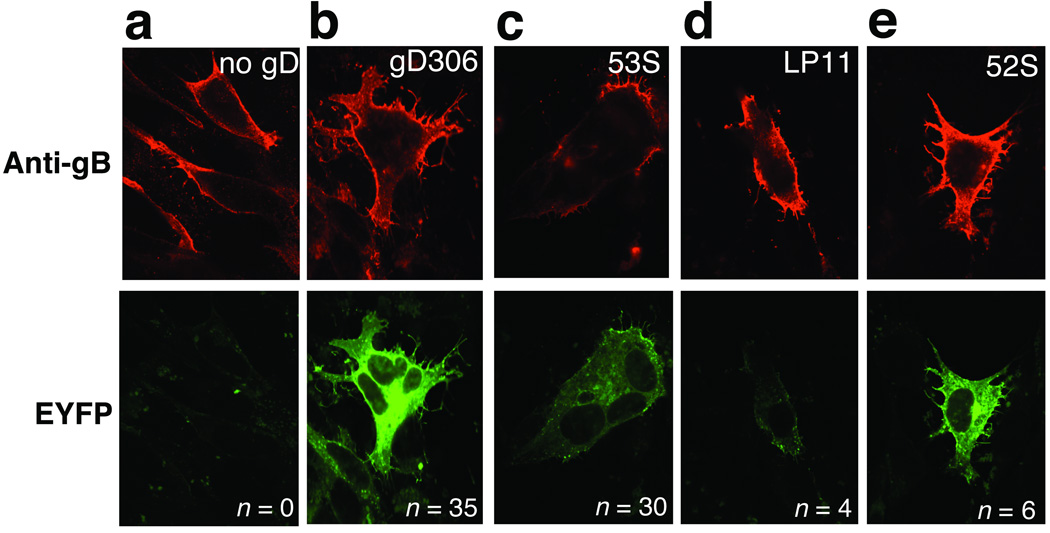
Fig. 6. Effect of anti-gH antibodies on gB–gH BiMC.
Top panels show gB surface expression (red) detected using immunofluorescence. Bottom panels show EYFP BiMC (bright green fluorescence). (a) no gD, (b) gD306, (c) gD306 plus mAb 53S, (d) gD306 plus mAb LP11, and (e) gD306 plus mAb 52S. n is the number of syncytia from a representative experiment. EYFP is enhanced yellow fluorescent protein.

