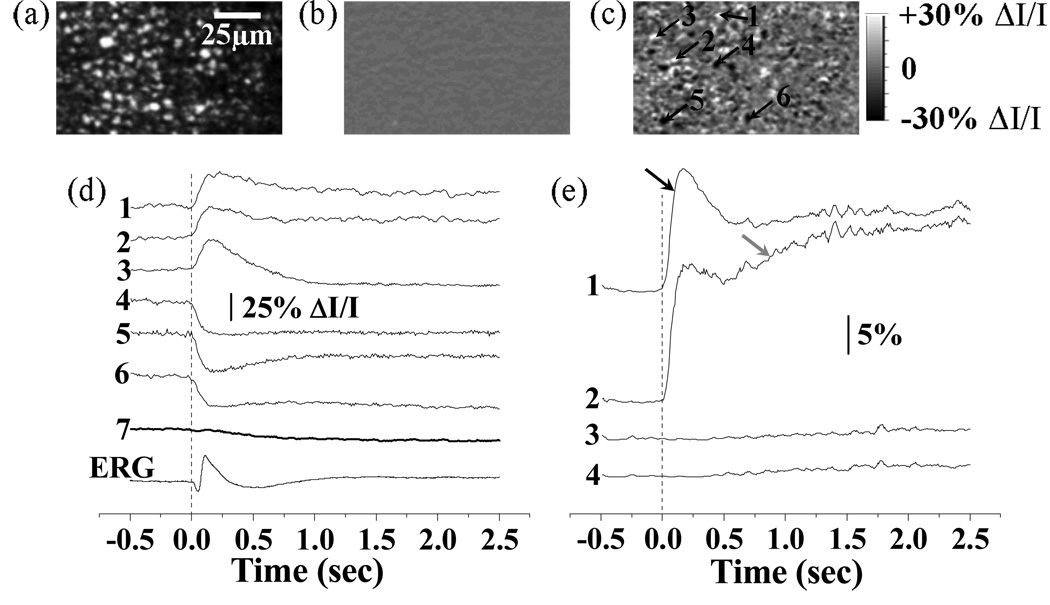
Fig. 2.
Frame-by-frame imaging of IOSs. (a) Raw image of photoreceptors. (b) Pre-stimulus IOS image. (c) Post-stimulus IOSs image. The raw confocal images were acquired at the speed of 100 frames/s, with NIR imaging light focused at photoreceptor layer. Both pre-stimulus and post-stimulus IOSs images were an average over 250 ms. (d) Tracings 1–6 revealed the IOSs variation property of local areas pointed by arrowheads 1–6 in (c). Tracing 7 represents integral IOSs by averaging all the pixels of each IOS image. Vertical line indicates the onset of the stimulus. (e) The percentage statistics of activated retinal areas with positive (> 5% ΔI/I) and negative (< −5% ΔI/I) IOSs. The threshold (5%ΔI/I) was used to reduce the effect of background noise on the statistics. Trace 1 (positive IOSs) and 2 (negative IOSs) are statistic results of experiment trial with stimulus delivered. Trace 3 (positive IOSs) and 4 (negative IOSs) are statistic results of control trial without stimulus.

