
Fig. 4.
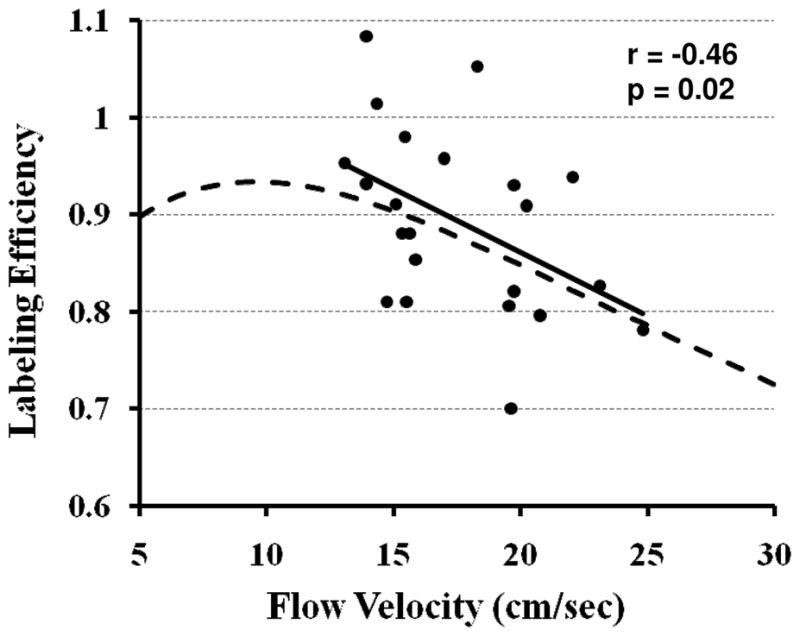
Experimental and simulation data of pCASL labeling efficiency as a function of flow velocity. The experimental data (filled dots) were from all subjects in Studies 2 and 3 (26 measurements). The solid line is the linear fitting of the experimental data. The simulation (dashed curve) used sequence parameters identical to those used in the experiments: RF duration=0.5 ms, pause between RF pulses=0.5 ms, labeling pulse flip angle=18°. The spins were assumed to be on-resonance and flowing at a constant velocity. The experimental data showed a significant correlation between labeling efficiency and flow velocity (r=−0.46, p=0.02).