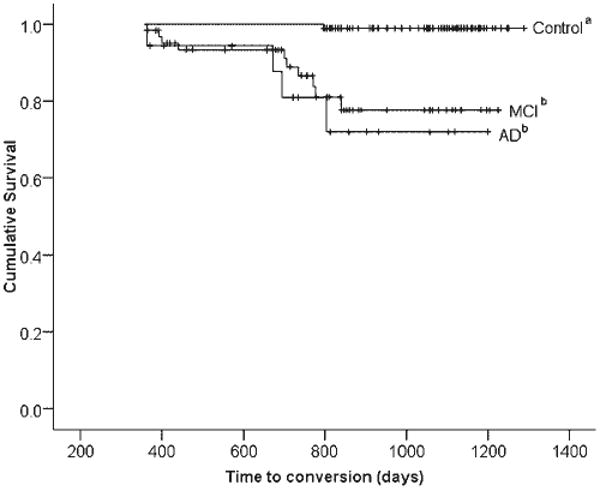
Fig. 2.

Kaplan-Meier survival curve depicting time to conversion to a consensus diagnosis of Alzheimer's disease (AD), broken down by the three Neuropsychological Assessment Battery (NAB) List Learning algorithm-defined groups (control, mild cognitive impairment [MCI], and AD). Lines represent data uncorrected for age and education. Lines marked with the same letter (“a” or “b”) do not differ significantly in hazards ratio after correcting for age and education in the Cox proportional hazards model. Vertical hash marks represent censored data.
