Fig 2.
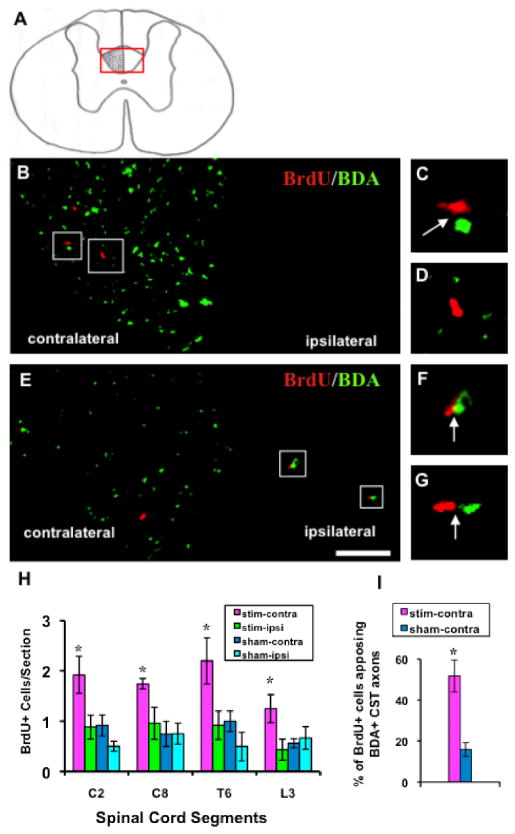
BDA+ CST axons (green) and BrdU+ nuclei (red) in electrically stimulated animals. A: Coronal spinal cord section. More than 95% BDA labeled CST axons project in the contralateral dCST. The red box indicates the micrographs in B and E. B: T6 section. C and D: higher magnification of boxed regions in B. BrdU+ nuclei distributed predominantly in contralateral dCST and most of them apposed BDA+ axons (C; arrow). D, BrdU+ cell not contacting a BDA+ axon. E: L3 section. Parts F and G, higher magnification of boxed regions in E. Sparse BDA+ axons in the ipsilateral dCST always closely apposed BrdU+ cells (arrows). Bar, 50 μm. H: BrdU+ nuclei in the dCST of the four groups. Number of labeled cells in experimental group (contralateral dCST of stimulated animals) was significantly greater than the three control groups (two-way ANOVA; *: p< 0.0001). I: There was a significantly higher percentage of BrdU+ cells contacting BDA+ axons in the contralateral dCST than in sham animals (t-test; *: p<0.01).

