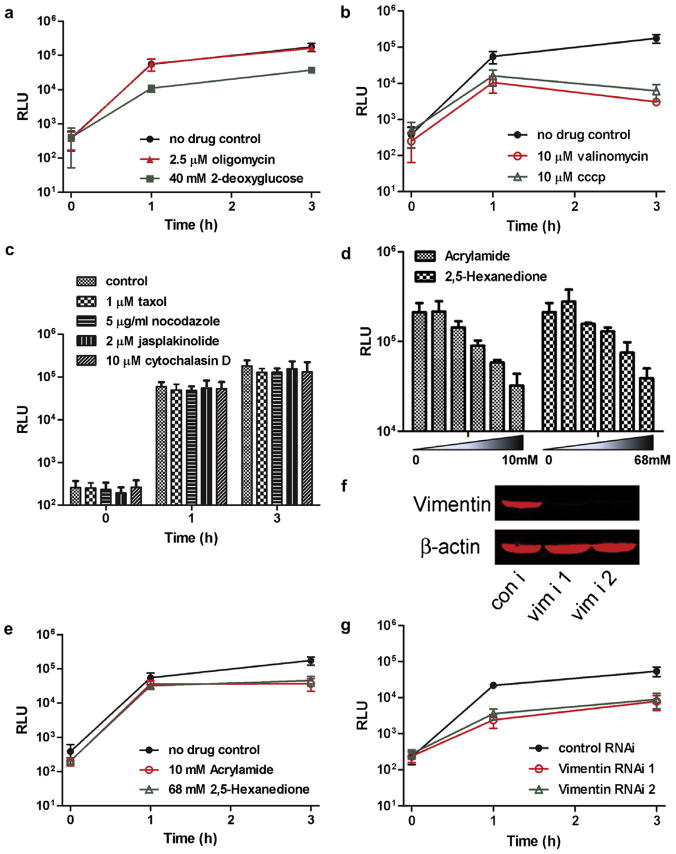
Fig. 3.
Mitochondrial fusion rates are affected by mitochondrial function inhibitors and cytoskeleton integrity. (A) Luminescence at the indicated times after cell fusion with no drug, 2.5 μM oligomycin, or 40 mM 2-deoxyglucose in medium lacking glucose (glucose-lacking medium in itself did not alter rates of fusion in comparison to control medium; data not shown). (B) Luminescence after cell fusion with no drug treatment, 10 μM valinomycin, or 10 μM CCCP. (C) Luminescence after fusion with no drug treatment, 1 μM taxol, 5 μg/ml nocodazole, 2 μM jasplakinolide or 10 μM cytochalasin D. (D) Luminescence 3 h after fusion in the indicated acrylamide or 2,5-hexanedione concentrations. (E) Luminescence after fusion with no drug treatment, 10 mM acrylamide, or 68 mM 2,5-hexanedione. Experiments from A to E were performed in HeLa cells. (F) Western blot analysis of vimentin, 90 h after siRNA transfection of COS-7 cells. (G) Luminescence of COS-7 cells stably expressing the split-Renilla luciferase reporters at the indicated times after cell fusion, 90 h after control siRNA or vimentin siRNA transfection.

