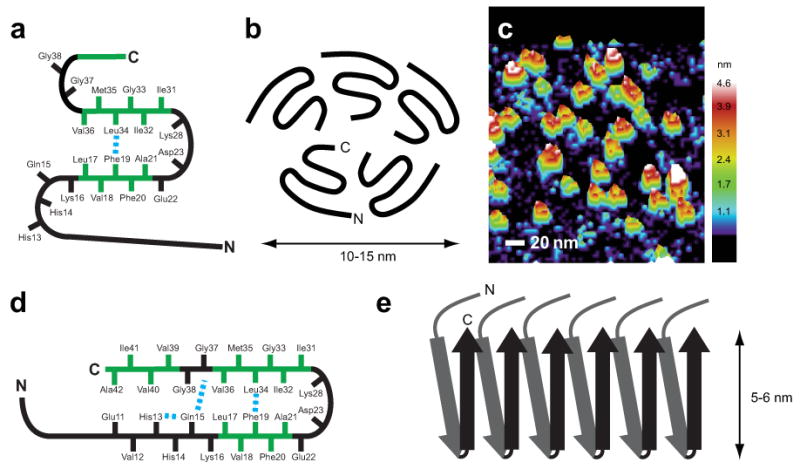
Figure 6.

Molecular models of Aβ42 oligomers and fibrils. (a) Schematic of the monomer within the oligomer complex of Aβ42. Solid-state NMR measurements show that Phe19 is in contact with Leu34, while amide exchange measurements suggest there are solvent accessible turns at His13–Gln15, Gly25–Gly29, and Gly37–Gly38. (b) Schematic of the Aβ42 pentamer. The composition of the oligomer is based on SEC and AFM. The orientation of the C-terminus toward the center of the pentamer is based on solvent accessibility. A similar orientation for the hexamer has been proposed by Berstein et al.32. (c) Three-dimensional image of single-touch AFM measurements of Aβ42 oligomers. (d) Schematic of the monomer within Aβ42 fibrils. (e) Schematic showing the parallel and in-register packing and staggering of the individual β-strands within Aβ42 fibrils. A single protofilament is shown. Mature fibrils may be formed by the association of 2–3 protofilaments.
