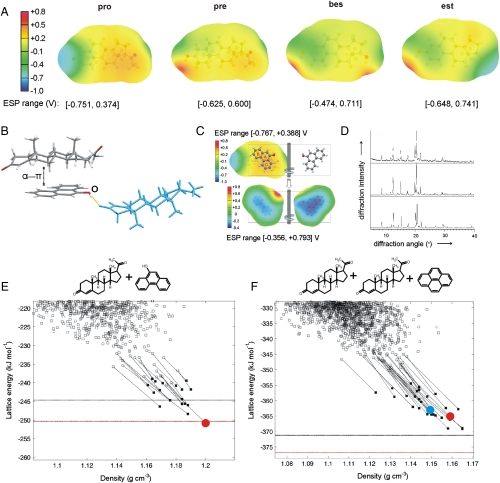
Fig. 2.
(A) Calculated B3LYP/6-31G(d,p) ESPs for representative, low-energy gas-phase conformations (< 1 kJ mol-1 less stable than global conformational minimum, for further information see SI Appendix, Section S4) of pro, pre, bes, and est on 2 × vdW surface; (B) crystal structure of the (pro).(13) complex displaying an α⋯π dimer and a hydrogen-bonded neighboring pro molecule (blue); (C) overlap of B3LYP/6-31G(d,p) ESPs (in V) on the 2 × vdW surface of the pro α-face (Upper) and 13 (ball-and-stick) for the conformations, relative position and orientation of the two molecules in the experimental crystal structure; ESP on both sides of 13 is shown for comparison (Lower), with the side facing pro labeled; (D) comparison of PXRD patterns measured for the grinding product (Upper), simulated for the predicted global minimum structure (Center) and simulated for the experimental structure (pro).(13) (Lower); (E) and (F) lattice energy vs. density landscapes for (pro).(13) and  . The open and filled squares correspond to rigid-body and flexible-molecule lattice energy minimizations, respectively. The horizontal black and red lines denote the sum of the lattice energies of the least and most stable polymorphs of the components, respectively, obtained with the same computational model that was used to minimize the experimental crystal structures (solid red circle). For
  the search structure (shown with a solid blue circle) that resembled most closely the minimized experimental solid-state complex differs by 0.49 Å in the 20 molecule coordination sphere and is 2 kJ mol-1 less stable.

