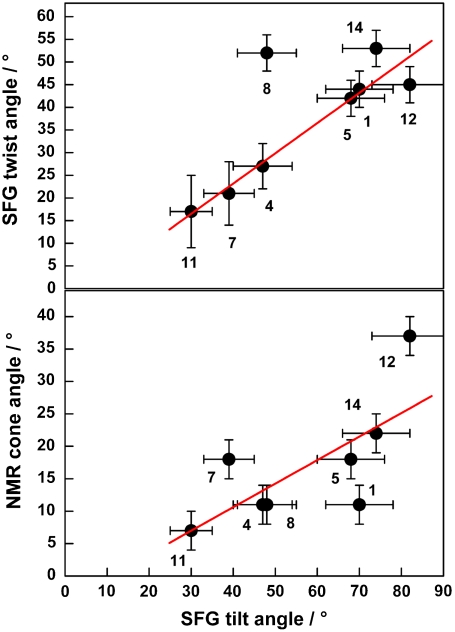
Fig. 3.
Top: Plot of the SFG twist and tilt angles for leucines at different positions within the peptide. The linear fit (red trace) reveals a correlation of R2 = 0.96 if Leu8 is not taken into account (0.77 including all points). Bottom: Correlation of SFG tilt and NMR cone angles. The correlation is weak but visible (R2 = 0.71).

