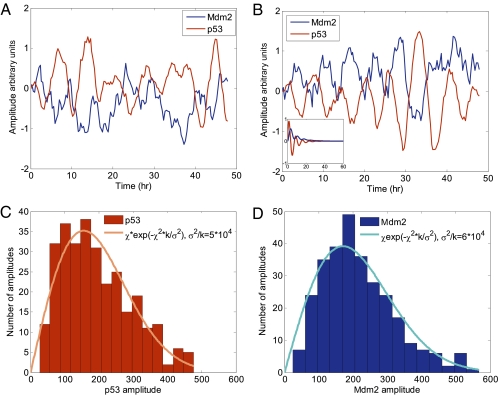
Fig. 5.
Stochastic simulation shows sustained oscillations. (A and B) Shown are two runs of a stochastic simulation based on the set of differential equations (Eq. 2) using the best-fit parameters. The calculated p53 and Mdm2 profiles resemble the experimentally measured profiles. A deterministic simulation with the same parameters (but without noise) results in damped oscillations (Inset). (C and D) The experimental amplitude distribution of p53 (C) and Mdm2 (D), and a fit to a theoretical model of noise-driven damped harmonic oscillator (37) (solid lines).

