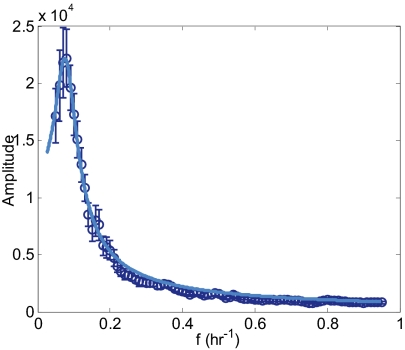
Fig. 6.
Fourier transforms of dynamics without DNA damage show a main peak, but not a rise at low frequencies. Shown is the RMS average over Fourier transforms of Mdm2–YFP levels. The measurement error was calculated as the SE of the individual Fourier transforms and is indicated by error bars. In this experiment, p53 dynamics were not measured. The calculated Fourier transform (solid line) is the solution of a second order Eq. 1 with parameters indicated in the text.

