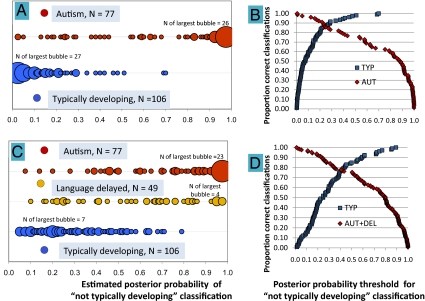
Fig. 3.
LDA with LOOCV indicating differentiation of child groups. Estimated classification probabilities were based on the 12 acoustic parameters. Results are displayed in bubble plots, with each bubble sized in proportion to the number of children at each x axis location (the number of children represented by the largest bubble in each line is labeled). The plots indicate classification probabilities (Left) and proportion-correct classification (Right) for LDA in (A and B) children with autism (red) versus typically developing children (blue) and (C and D) a combined group of children with autism (red) or language delay (gold) versus typically developing children (blue).

