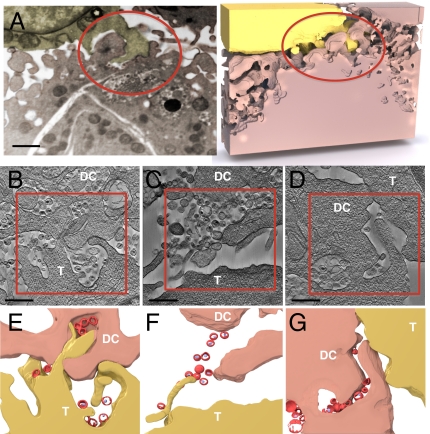
Fig. 3.
IA-SEM and electron tomography of contact regions between dendritic cells and T cells illustrating HIV-1 distribution within the virological synapse. (A) Interdigitation of membrane protrusions from the T cell (shown in yellow) into the dendritic cell (shown in pink) surface and connection of virion-rich compartments in the interior of the dendritic cell to the synapse via HIV-containing channels (red circle; Movie S3). (B–D) Tomographic slices obtained from ~200-nm thick sections of cocultures of HIV-1–pulsed dendritic cells (DC) mixed with CD4+ T cells (T) illustrating different structural aspects of the cell-cell contacts that define the synapse. (E–G) Segmentation of regions boxed in B–D to indicate membrane contact and virus (red) location. (Scale bar: A, 1 μm; B–D, 0.4 μm.)

