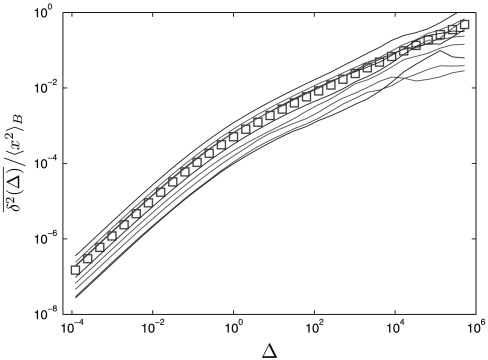
Fig. 3.
Single trajectories for the motion in the harmonic binding potential U(x) = x2, for the same parameters as in Fig. 2 (thin lines). The symbols (□) represent the simulations result for  . The scatter between individual trajectories is distinct and resembles qualitatively typical experimental results (24–29).

