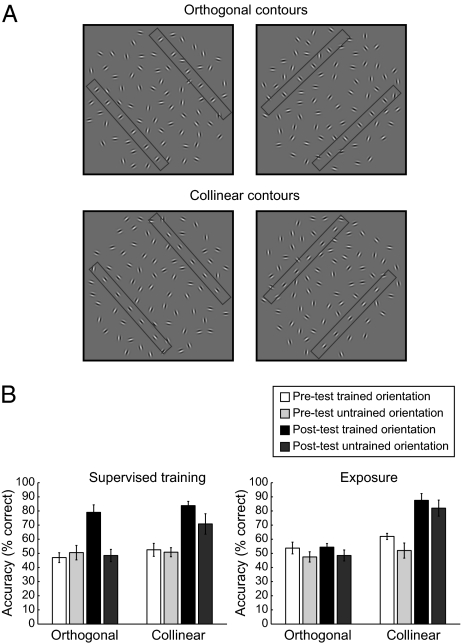
Fig. 1.
Stimuli and behavioral results. (A) Examples of collinear and orthogonal contours used for behavioral testing presented at two different contour orientations (45° and 135°). For demonstration purposes only, two rectangles illustrate the position of the two contour paths in each stimulus. (B) Average behavioral performance across subjects (percent correct) before and after supervised training or exposure. Error bars denote SEM.

