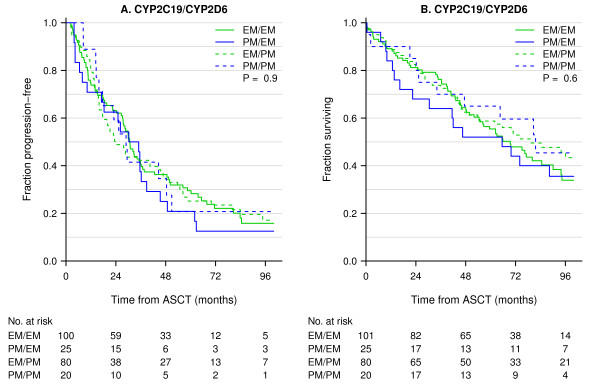
Figure 2.
Kaplan-Meier plots of TTF and OS in all patients treated with high-dose treatment using combinations of genotypes CYP2C19 and CYP2D6. The numbers at risk at 0, 24, 48, 72 and 96 months are presented below the figure. 1) EM for CYP2C19 and EM for CYP2D6 (solid green line); 2) PM for CYP2C19 and EM for CYP2D6 (solid blue line); 3) EM for CYP2C19 and PM for CYP2D6 (dashed green line); 4) PM for CYP2C19 and PM for CYP2D6 (dashed blue line).

