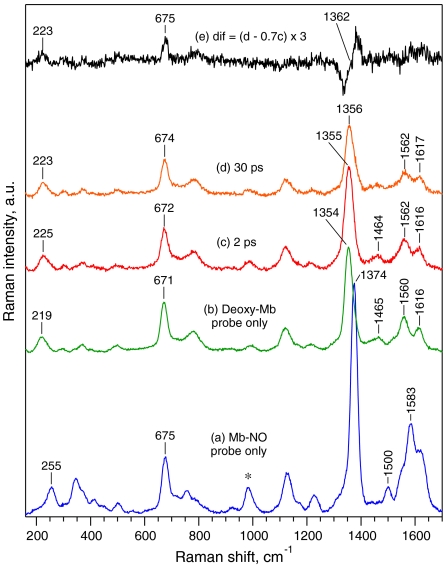
Fig. 3.
TR3 spectra in the range 150–1,700 cm-1 of Mb-NO (a, probe only), deoxy-Mb (b, probe only), Mb-NO photoproducts (species D + B + X + const) at Δt = 2 ps (c) and Δt = 30 ps (d), and the weighted difference (e) of spectrum (d) minus spectrum (c). Note that trace (e) is magnified 3 times. The asterisk indicates Raman band of  utilized for intensity normalization.

