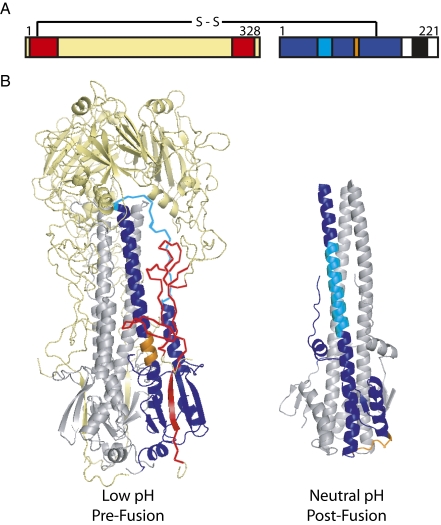
Fig. 1.
Structures defining the conformational changes of HA-induced membrane fusion. (A) The primary structure of cleaved HA. Color indicates the regions defined in B. (B) Two high-resolution structures of influenza HA representing the prefusion neutral-pH (Left) (16) and postfusion low-pH conformations (Right) (17). Trimers are depicted with HA1 (yellow) and HA2 (gray). One monomer is colored to indicate residues present in the HA2-stalk antigen, HA6 (2) (HA1 7–46 and 290–321 are red; HA2 1–172 is blue). Two regions within HA2 (and HA6) that change conformation between the neutral-pH and low-pH structures are indicated (55–76 in cyan and 106–112 in orange). Figure drawn with PyMOL.

