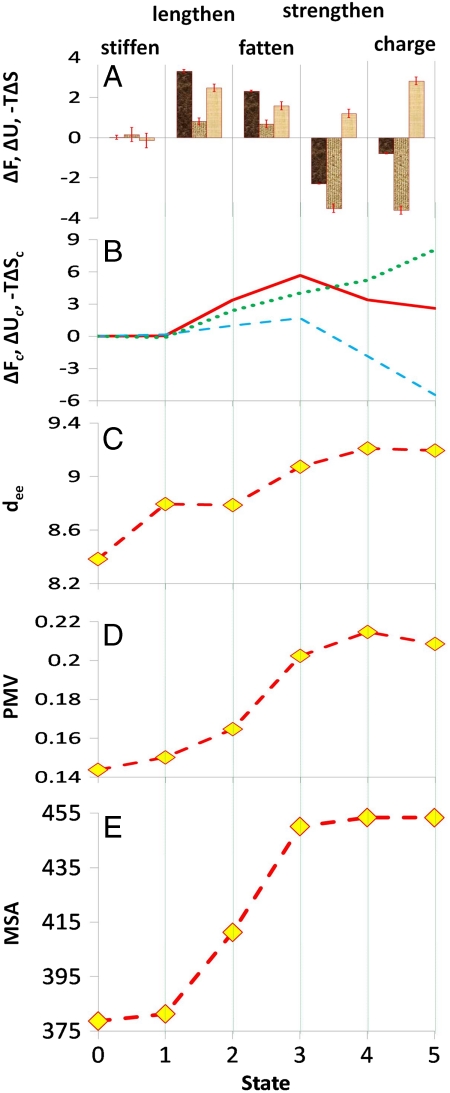
Fig. 2.
Plots of various quantities of interest associated with solute transformation in water (298.16 K and ∼1 atm). (A) For the various transformations, ΔF (first column of each set) is the change in the hydration free energy. ΔU (second column of each set) and -TΔS (third column of each set) are the corresponding contributions due to changes in internal energy and entropy respectively. Also shown are standard-error bars calculated using the procedure of Hess (45). (B) Cumulative values of the change in free energy (ΔFc, solid line), and the energetic (ΔUc, dashed line) and entropic (-TΔSc, dotted line) contributions to it for the various states. ΔFc for each state i (i = 1,5) is the difference in solvation free energy between state i and state 0. (C) End-to-end distance (dee, Å), i.e., separation between the terminal carbon atoms for the various states, a measure of stiffness of the solute due to torsional and to steric effects. (D) Partial molar volume (PMV, m3/kmol) for each state. (E) Molecular surface area (MSA, Å2) for each state. All energies are in kcal/mol.

