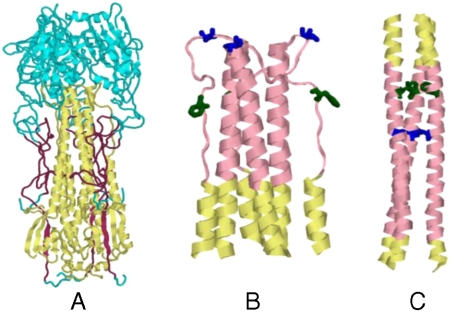
Fig. 1.
Structures of the HA ectodomain. (A) Regions that are included in HA6 are shown in either maroon (HA1) or yellow (HA2). The rest of the molecule is shown in cyan. This figure was derived from the X-ray structure of HA from the (H3N2) isolate A/HK/68 (PDB ID code 1HGD) (7) and was drawn using the program Rasmol (41). Conformation of residues (45–110) HA2 in the neutral pH (B) and low pH (C) structures of HA. The stretch 57–98 is shown in pink and the HA2 residues 63F and 73V, which are buried in the low pH form but are exposed in the neutral pH form, are shown in green and blue, respectively. Only a portion of the HA2 trimer (residues 45–110) is shown here for clarity.

