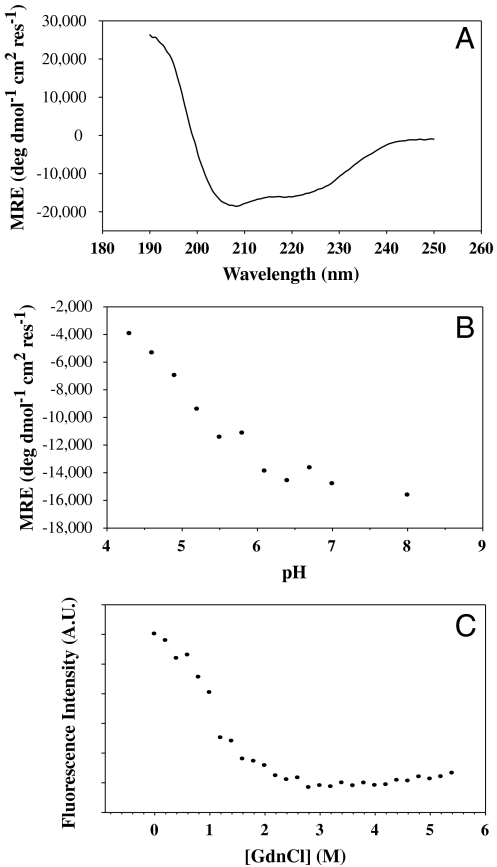
Fig. 3.
Spectroscopic analysis of HA6. (A) Far UV CD spectrum of 5 μM HA6 in PBS, pH 7.4 at 25 °C. (B) Mean residue ellipticity of HA6 as a function of pH in 5 mM citrate glycine HEPES buffer, 25 °C. The molecule loses its helicity as the pH is lowered, confirming that HA6 does not form the extended coiled coil structure observed at the low pH for WT HA2 (6). (C) Isothermal Chemical Denaturation curve at pH 8.0, 25 °C for 2 μM HA6. The denaturation of the protein was monitored by the fluorescence intensity at 338 nm as a function of denaturant concentration.

