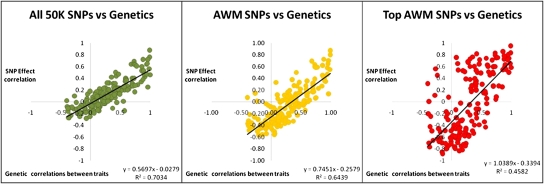
Fig. 1.
Genetic correlations between traits compared with SNP-based correlations. Genetic pairwise correlations estimated for 19 traits were compared with SNP-based correlations for all 50,070 SNPs in green (R2 = 0.7034), AWM 3,159 SNPs in yellow (R2 = 0.6439), and the top 71 SNPs from the AWM in red (R2 = 0.4582).

