Fig. 4.
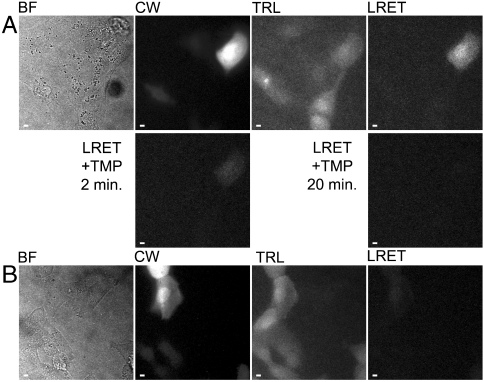
Time-resolved LRET imaging reveals interaction between ZO-1/PDZ1-eDHFR and GFP-cldn1/tail in MDCKII cells. (A), (B) Micrographs: BF, bright field; CW, continuous wave fluorescence (λex = 480 ± 20 nm, λem = 535 ± 25 nm); TRL, time-resolved luminescence (λex = 365 nm, λem > 400 nm, gate delay = 10 μs); LRET, time-resolved luminescence (λex = 365 nm, λem = 520 ± 10 nm, gate delay = 10 μs); LRET + TMP, after addition of TMP (final conc. = 10 μM) to growth medium at indicated time-points. LRET and LRET + TMP images were adjusted to identical contrast levels. Complete details of time-resolved microscopy parameters are provided in SI Materials and Methods and Table S2. Scale bars, 10 μm. (A) MDCKII cells coexpressing ZO-1/PDZ1-eDHFR and GFP-cldn1/tail loaded with TMP-Lumi4 by osmotic lysis of pinosomes. Terbium-to-GFP LRET is seen only in transfected cells loaded with TMP-Lumi4. When TMP is added to culture medium, it displaces TMP-Lumi4 from the ZO-1/PDZ1-eDHFR/GFP-cldn1/tail complex, eliminating the LRET signal. (B) MDCKII cells coexpressing ZO-1/PDZ1-eDHFR and GFP-cldn1/tailΔYV, loaded with TMP-Lumi4 as in (A). No LRET signal is seen in expressing cells loaded with TMP-Lumi4.

